在自架的 FreeNAS 設備上監控主機狀態運行的過程
FreeNAS 本身的監控畫面,並沒有太好的監控便利性,老實說並不是那麼好操控
所以打算架設一個主監控,來方便閱覽每個環節的變化、服務的運行是否穩定、異常的預警告知
版本
- Server
- FreeNAS: v11.3-U3.2
- Data visualization
- Grafana: v6.7.4
- Collector
- Prometheus: v2.17.1
- Node_Exporter: v0.18.1
Prometheus
簡單介紹,是一套使用 Go 開發的開源系統監控報警框架,通過 HTTP 協議週期性抓取被監控組件的狀態
Installation
首先登入至 FreeNAS , 可以透過 SSH 登入 或 圖形介面的 Shell 操作
然後從 Github - Prometheus 下載 Linux - amd64 版本
|
|
RC Script - Prometheus
撰寫 Prometheus 的 RC Script,方便啟動
將 rc-prometheus 寫入 /usr/local/etc/rc.d/prometheus
並且記得加上執行權限
|
|
Prometheus - Node_Exporter
如果單單只是安裝 Prometheus 並不直接服務監控特定的目標,需要透過 Exporter 來採集主機上的訊息
透過安裝 Prometheus-Node_Exporter 來蒐集系統上的資訊
|
|
RC Script - Node_Exporter
將 rc-node_exporter 寫入 /usr/local/etc/rc.d/node_exporter
|
|
Configure
編輯 Prometheus.yml,將 Node_Exporter 加入至設定中,使 Prometheus Server 能夠從 Node_Exporter 獲得監控資訊
|
|
Reboot
重新啟動 FreeNAS,確認 Prometheus 及 Node_exporter 可以正常自動啟動
|
|
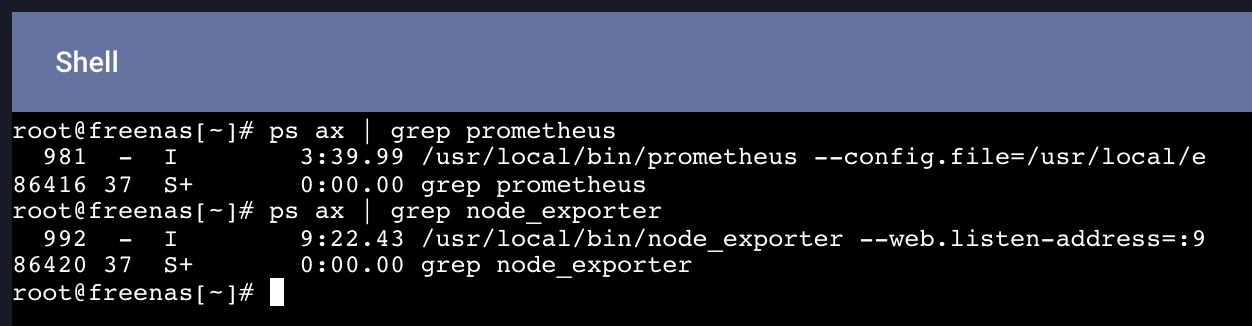
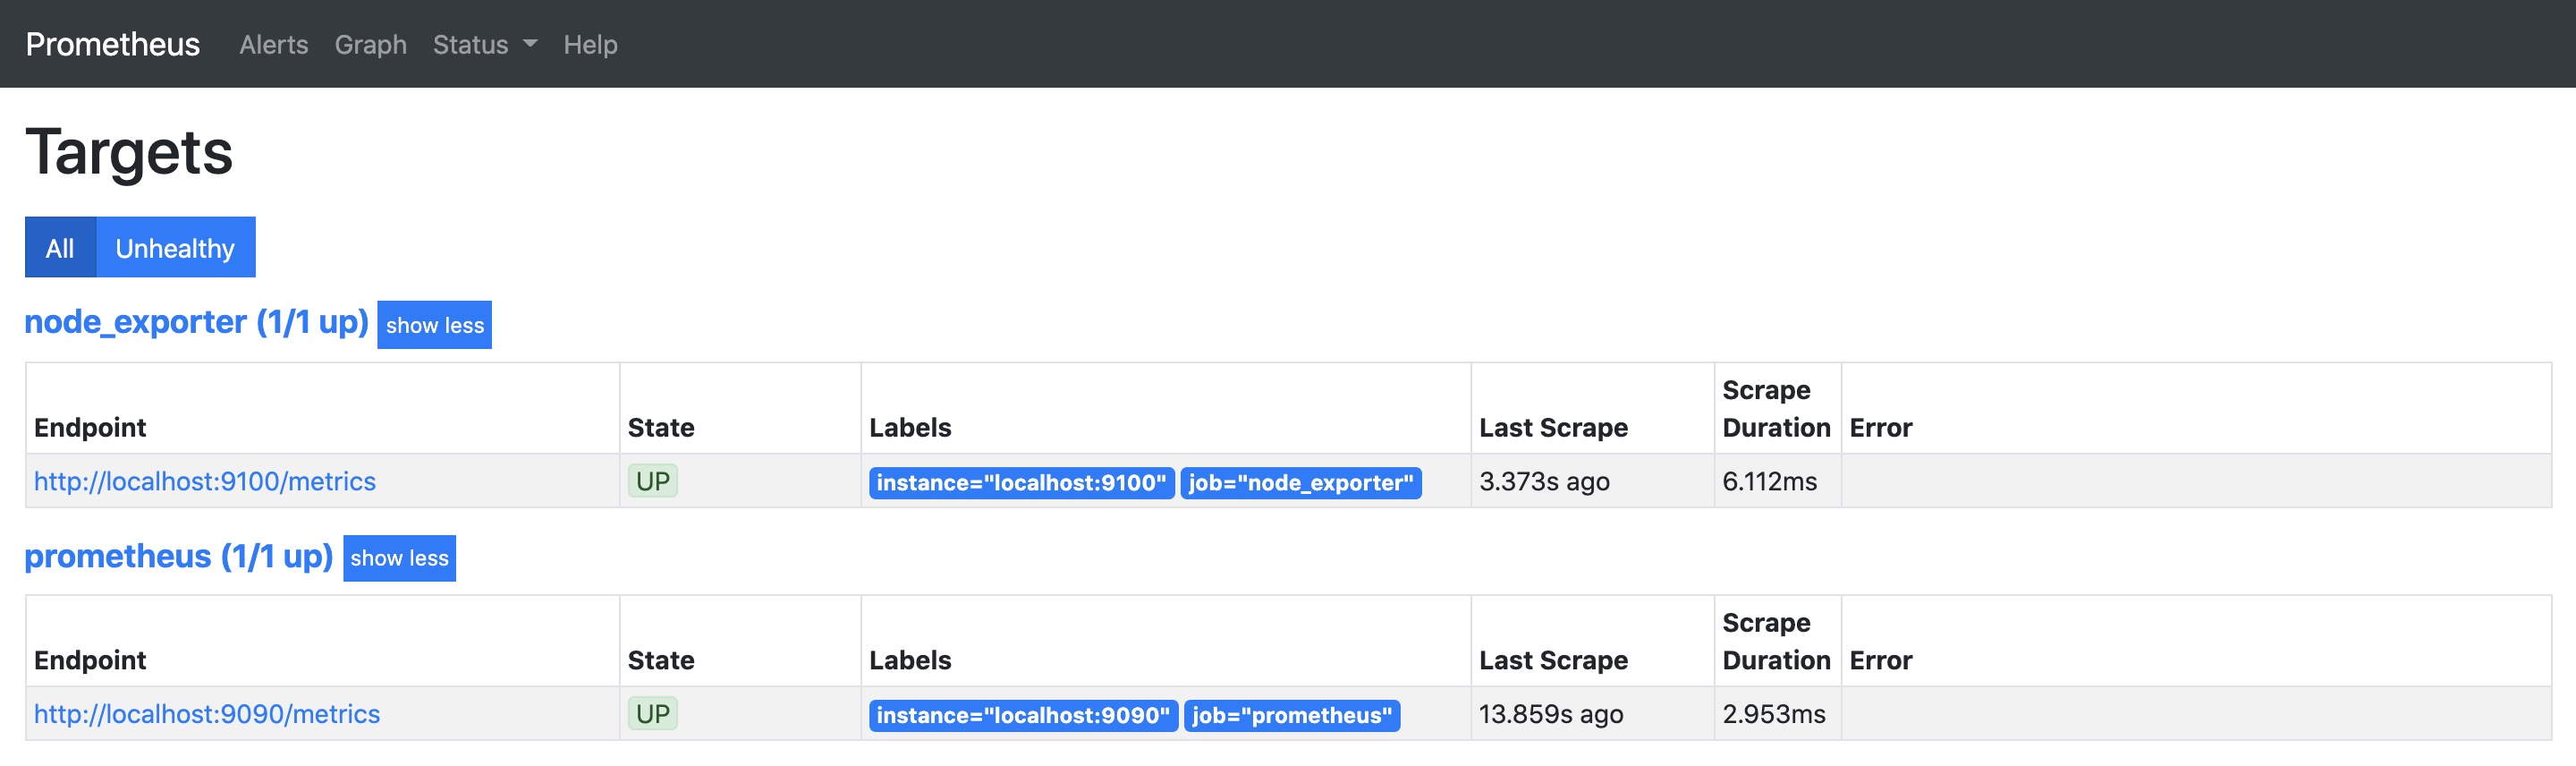
可以透過 http://<FreeNAS IP>:9090/targets 確認數據是否正常獲取
Grafana
簡單介紹,是一套使用 Go 開發的開源的數據監控視覺化介面,支援多種資料來源,將資料視覺化等相關功能
Installation
FreeNAS 中的 Plugins 本身就可以在 Community 中找到並直接安裝 Grafana
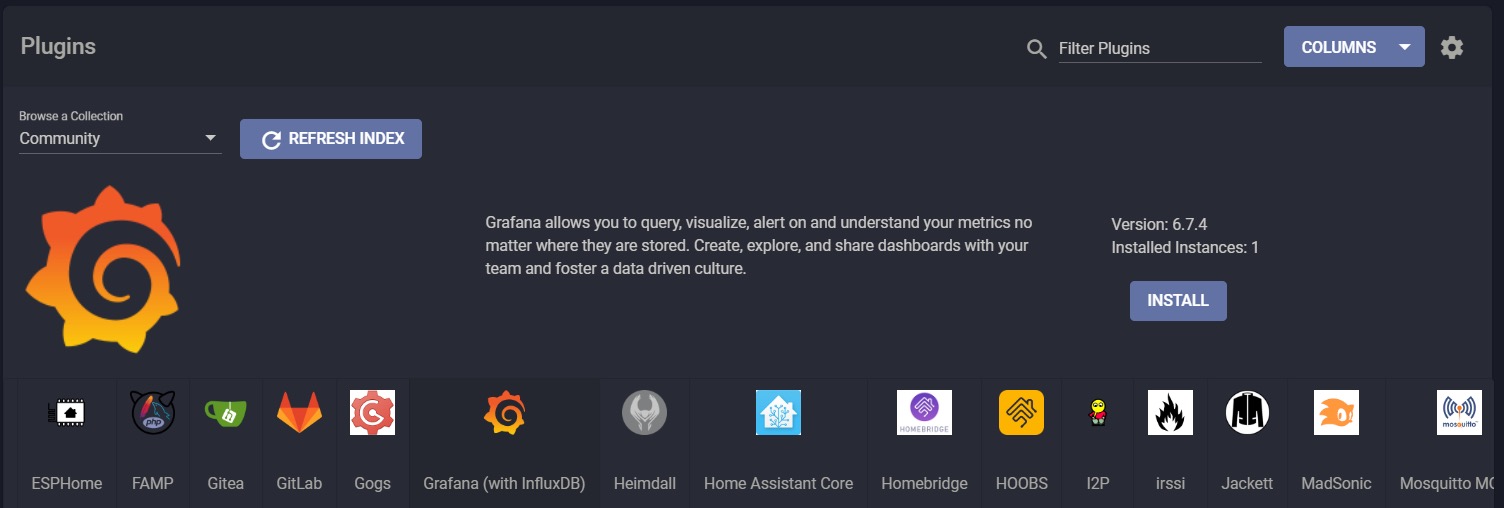
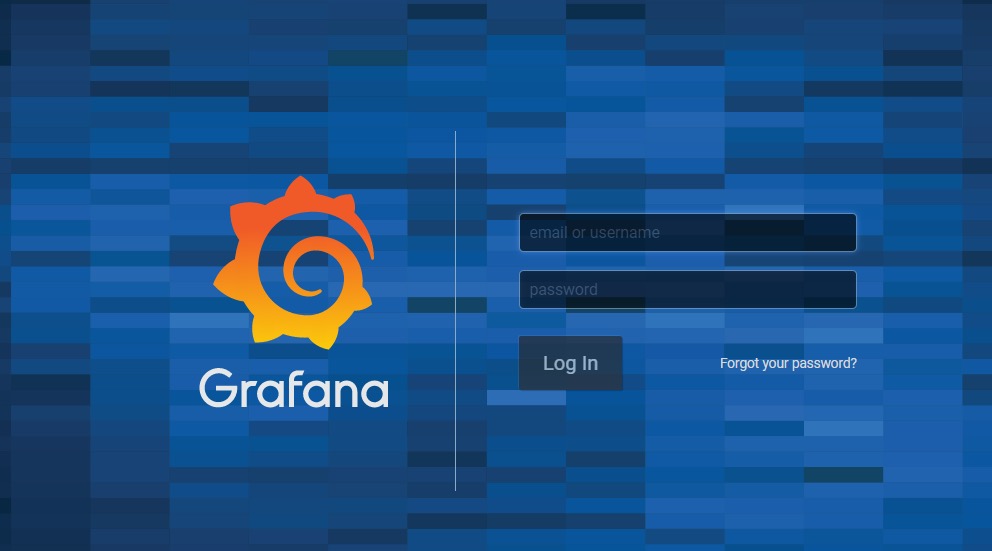
安裝中的網路設定各不相同,這邊就不演示,安裝完成後就可以透過網址登入到 Grafana 的頁面中
我則是使用 Port Forwarding,所以是 http://<FreeNAS IP>:3000 可以登入至 Grafana
Data Source
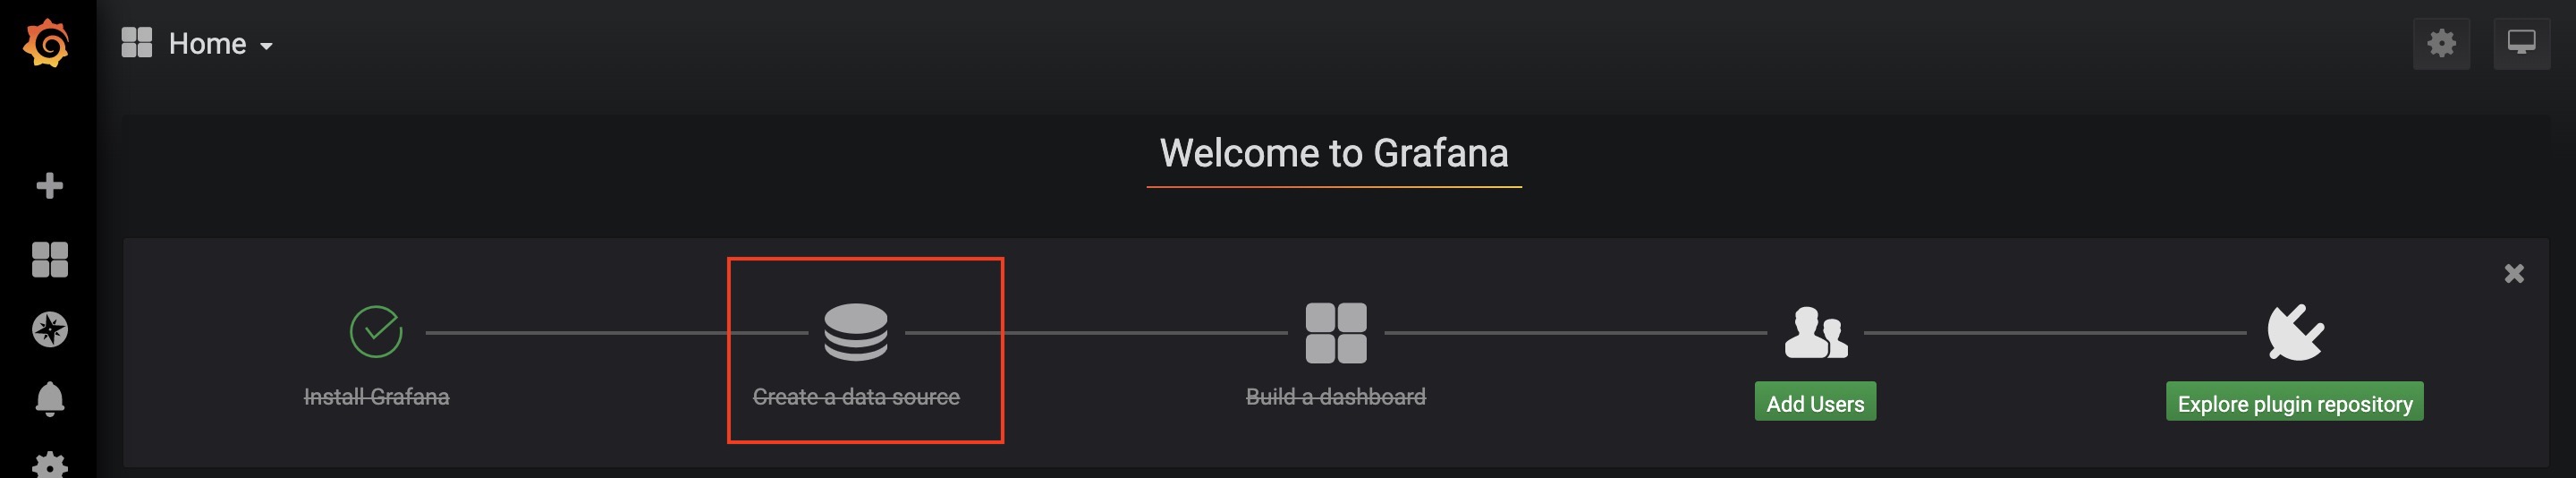
在首頁選擇 Create Data Source,建立資料來源
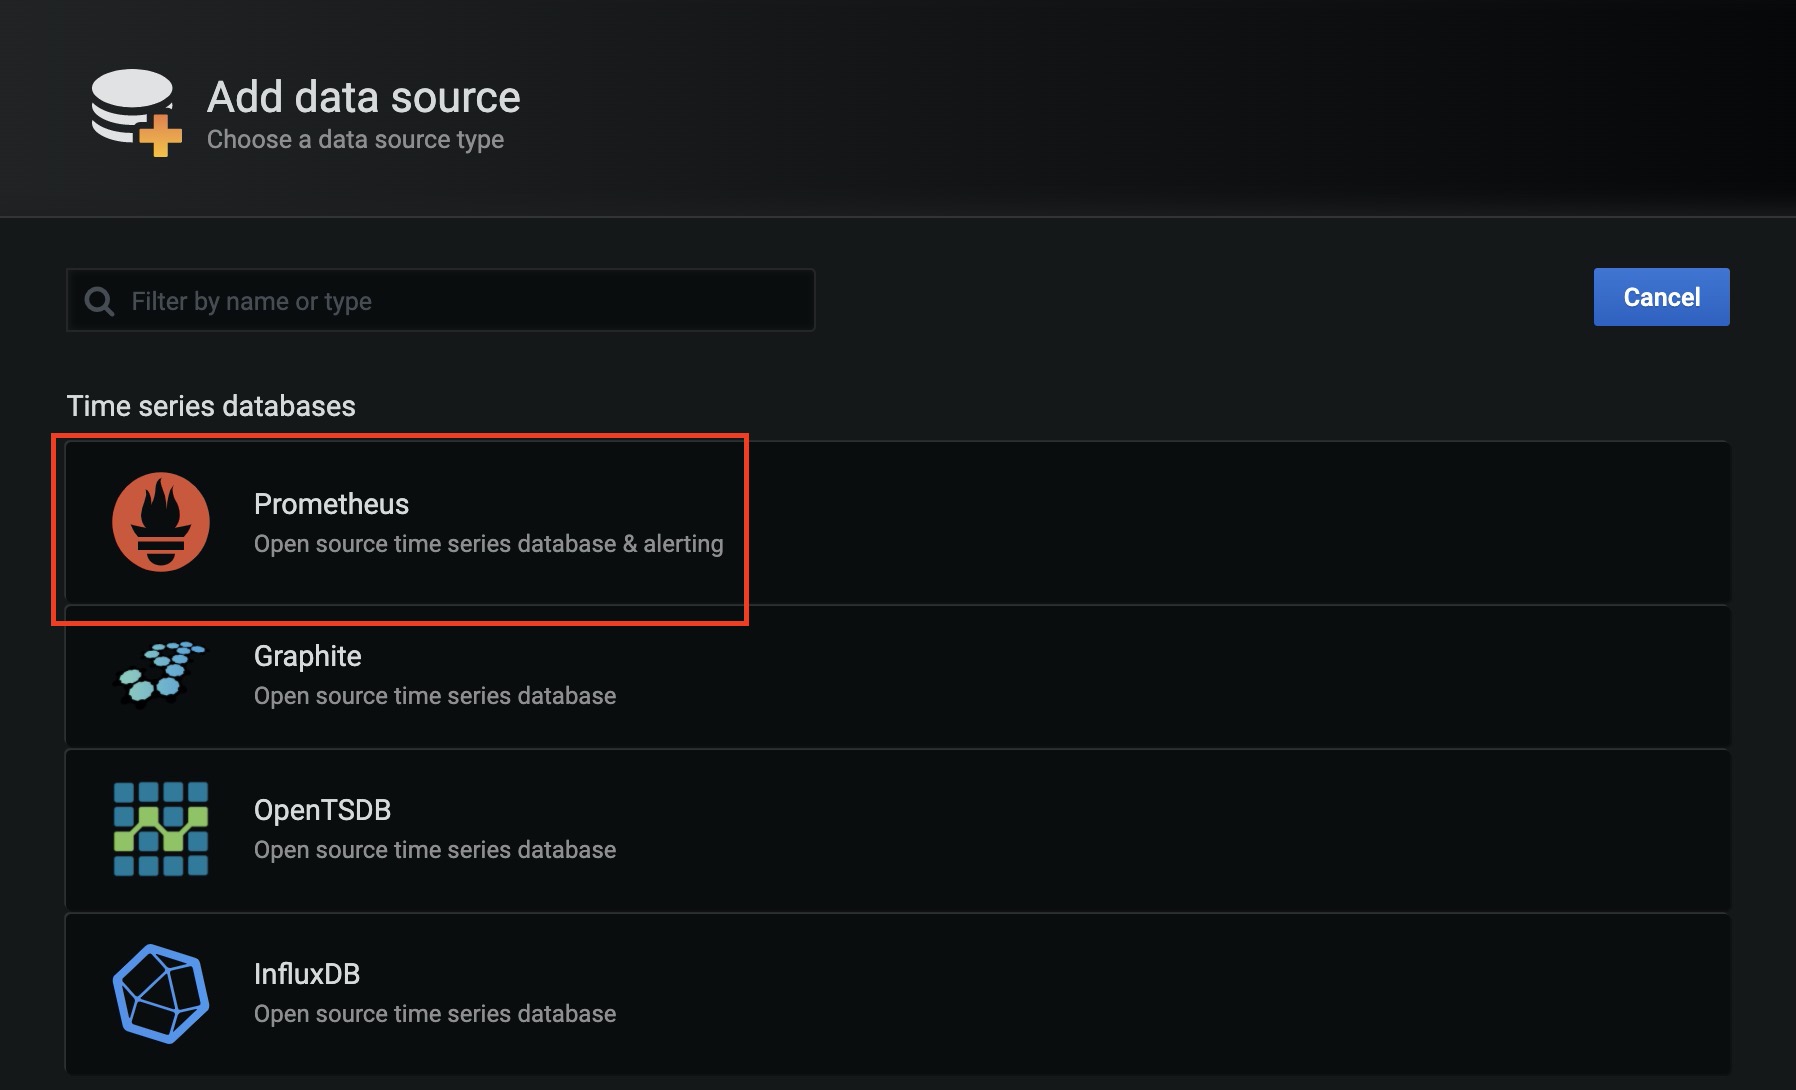
Grafana 支援多種資料來源可供選擇,這裡則是選擇 Prometheus
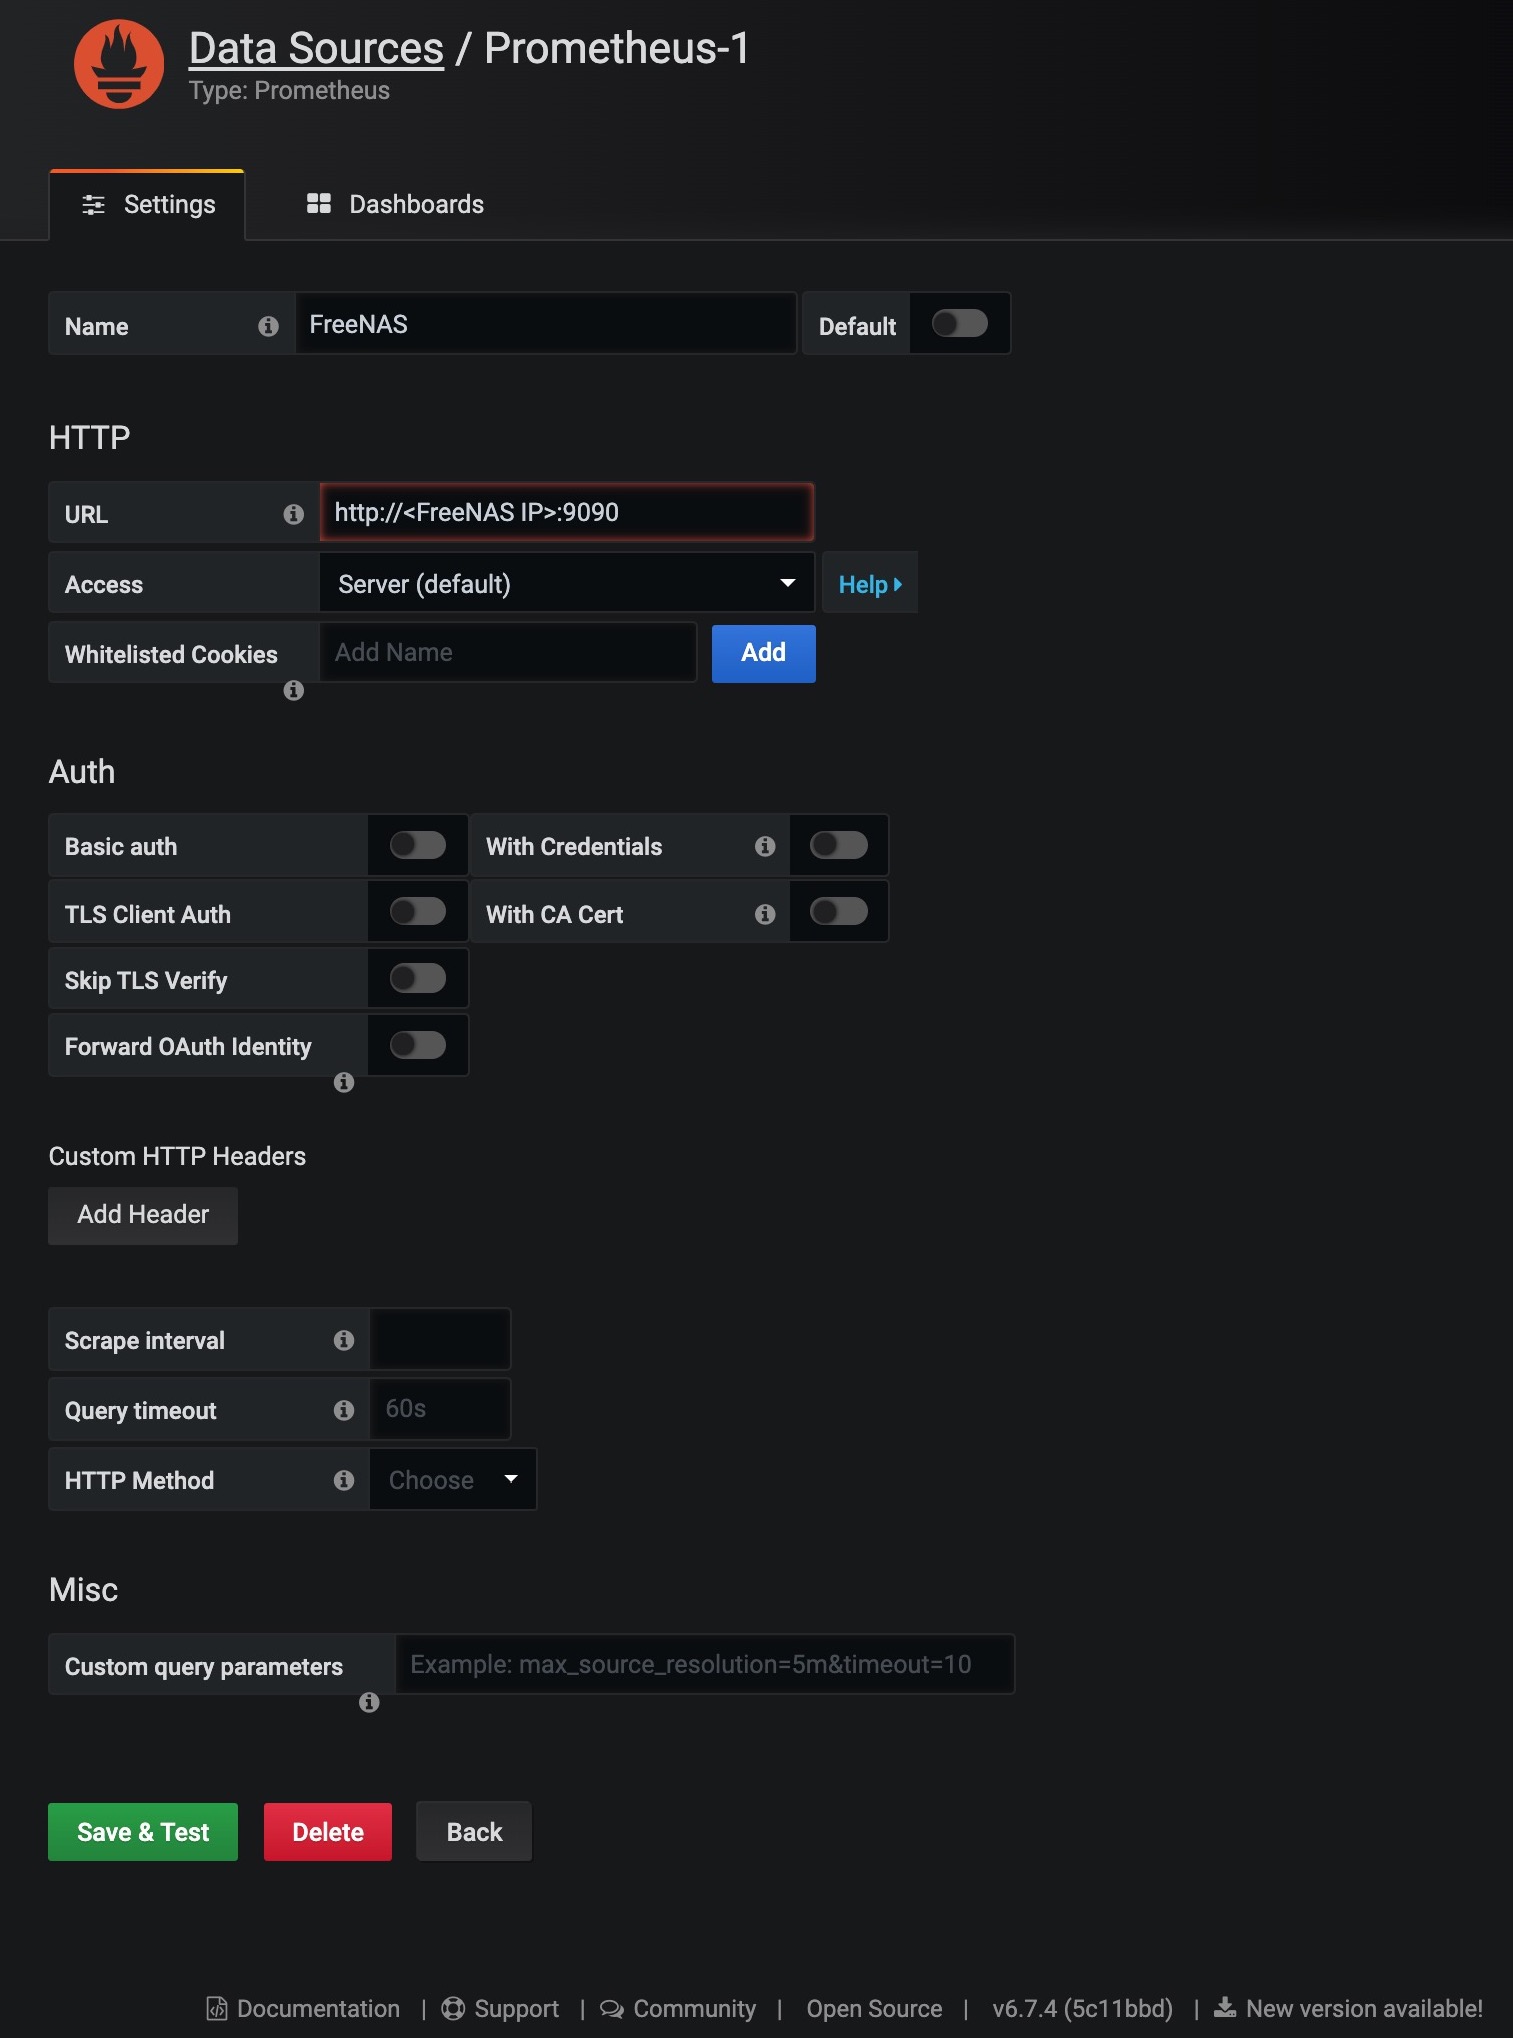
填寫資料來源的名稱,並且指定目標 URL 填入 Prometheus 的資料來源
儲存的同時會進行測試確認是否正常啟動
Dashboard
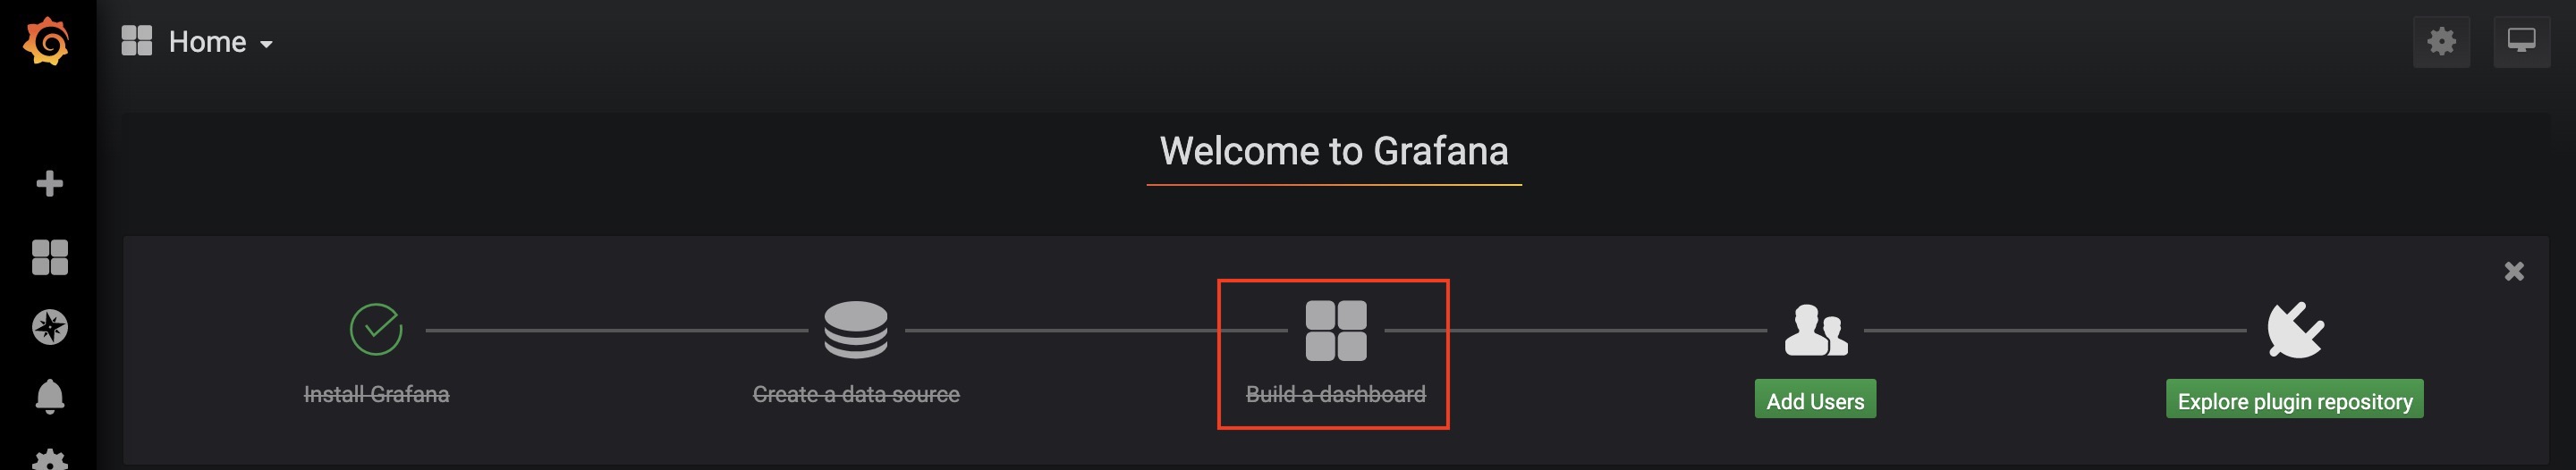
確認資料來源後,當然就是將資料進行視覺化,在首頁中選擇 Build Dashboard 打造首頁
點選左上角的 New dashboard
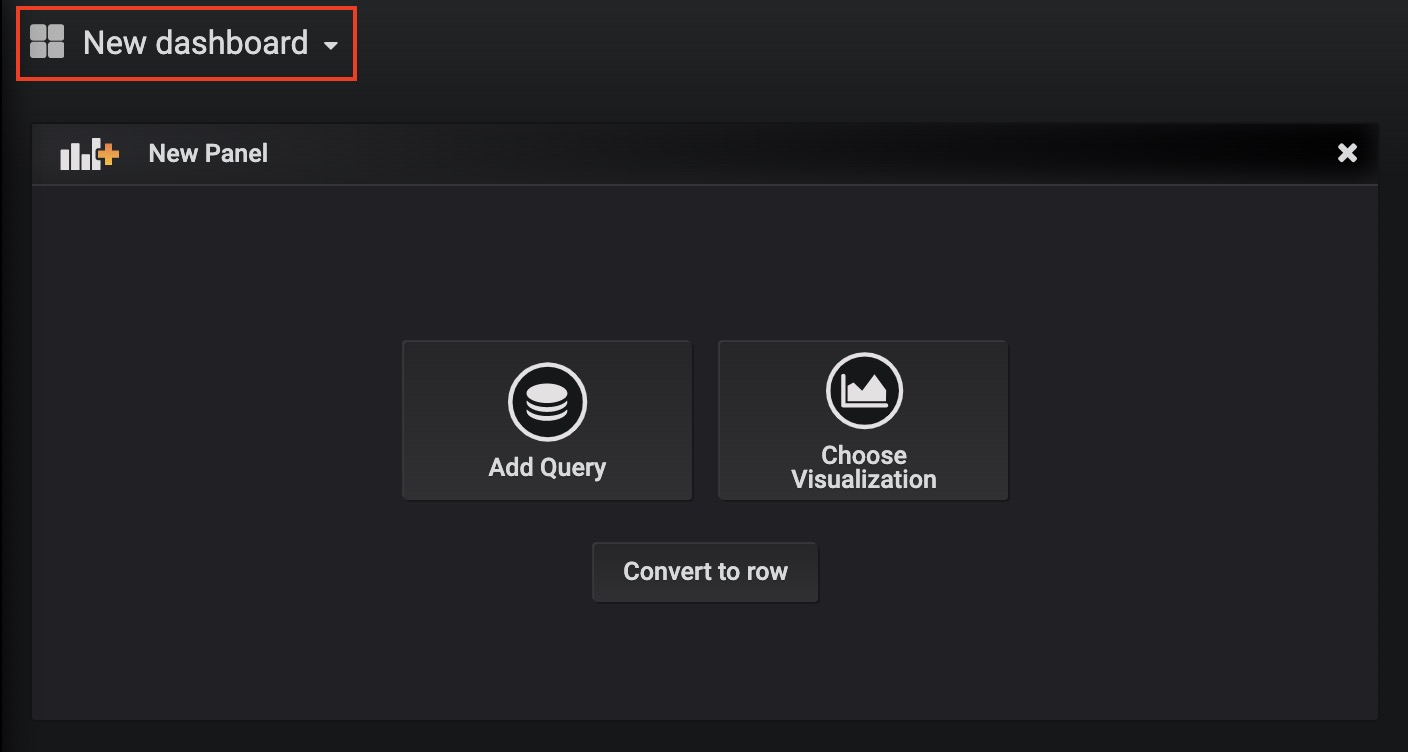
不過這裡求快速,則使用別人已經打造好的監控畫面,並簡單的修改大小
當然如果是重頭開始打造可能會有點麻煩,不過還是可以依照自己的需求進行各個監控元件
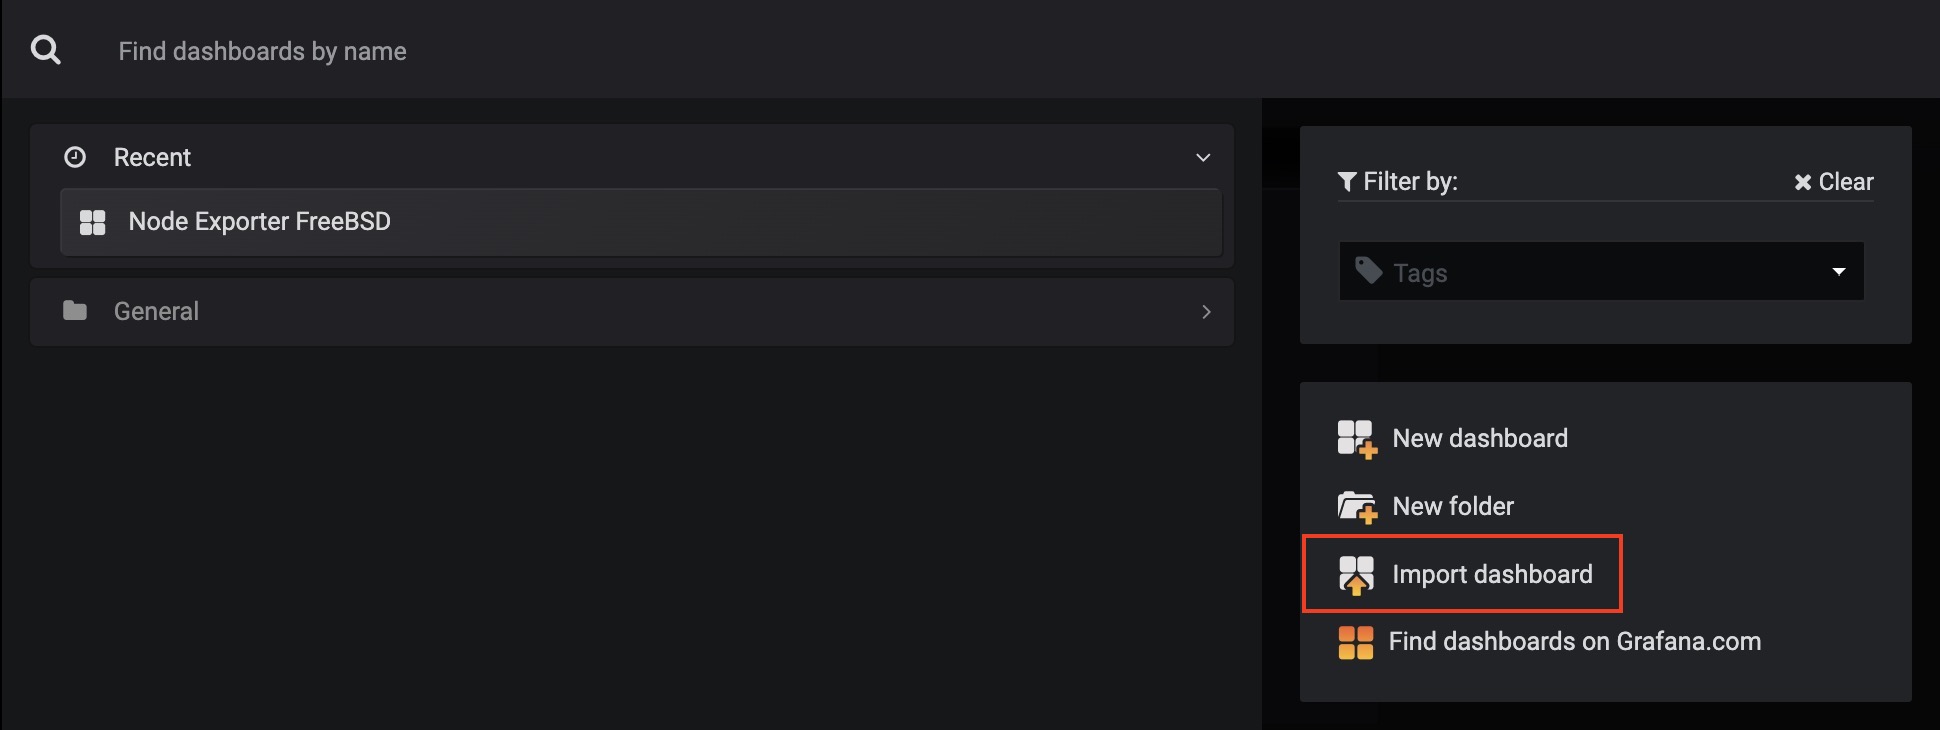
然後選擇 Import dashboard
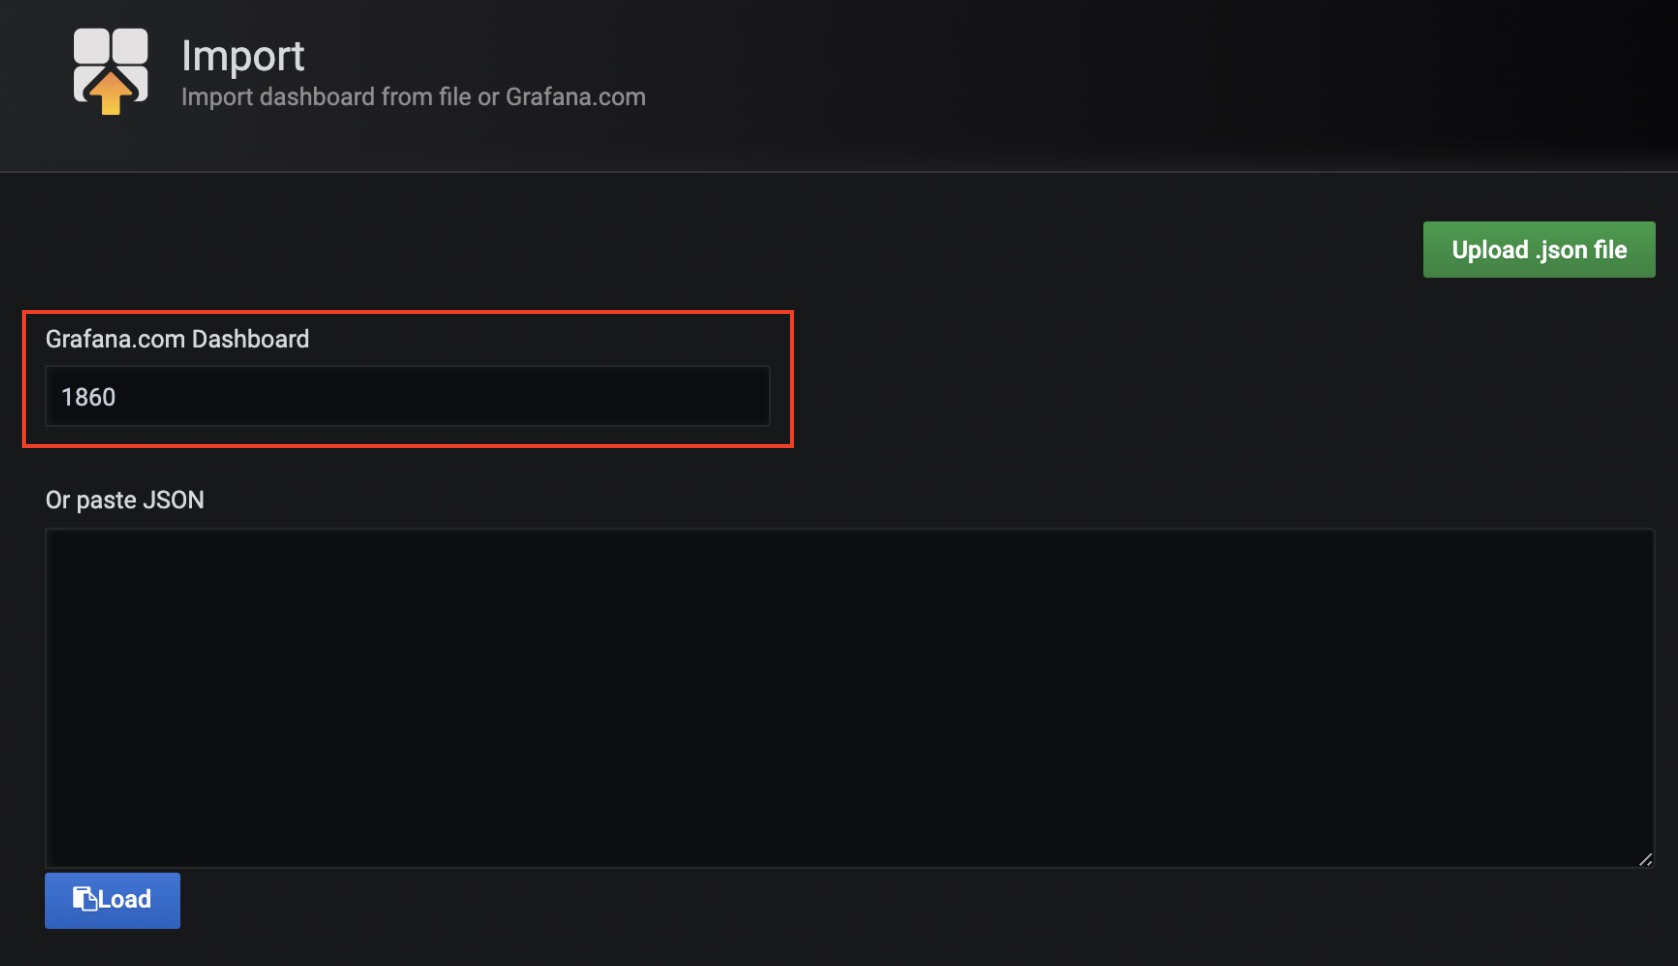
從 Garfama.com Dashboard 取得現成的監控版型,這裡填入 1860
可以從 Grafana - Dashboard 去找尋自己喜愛的版型,如果真的找不到就自己慢慢拉
然後會從 Garfama.com 自動將 json 進行載入
填寫儀表板的名稱,並且選擇特定的 Prometheus 資料來源 FreeNAS
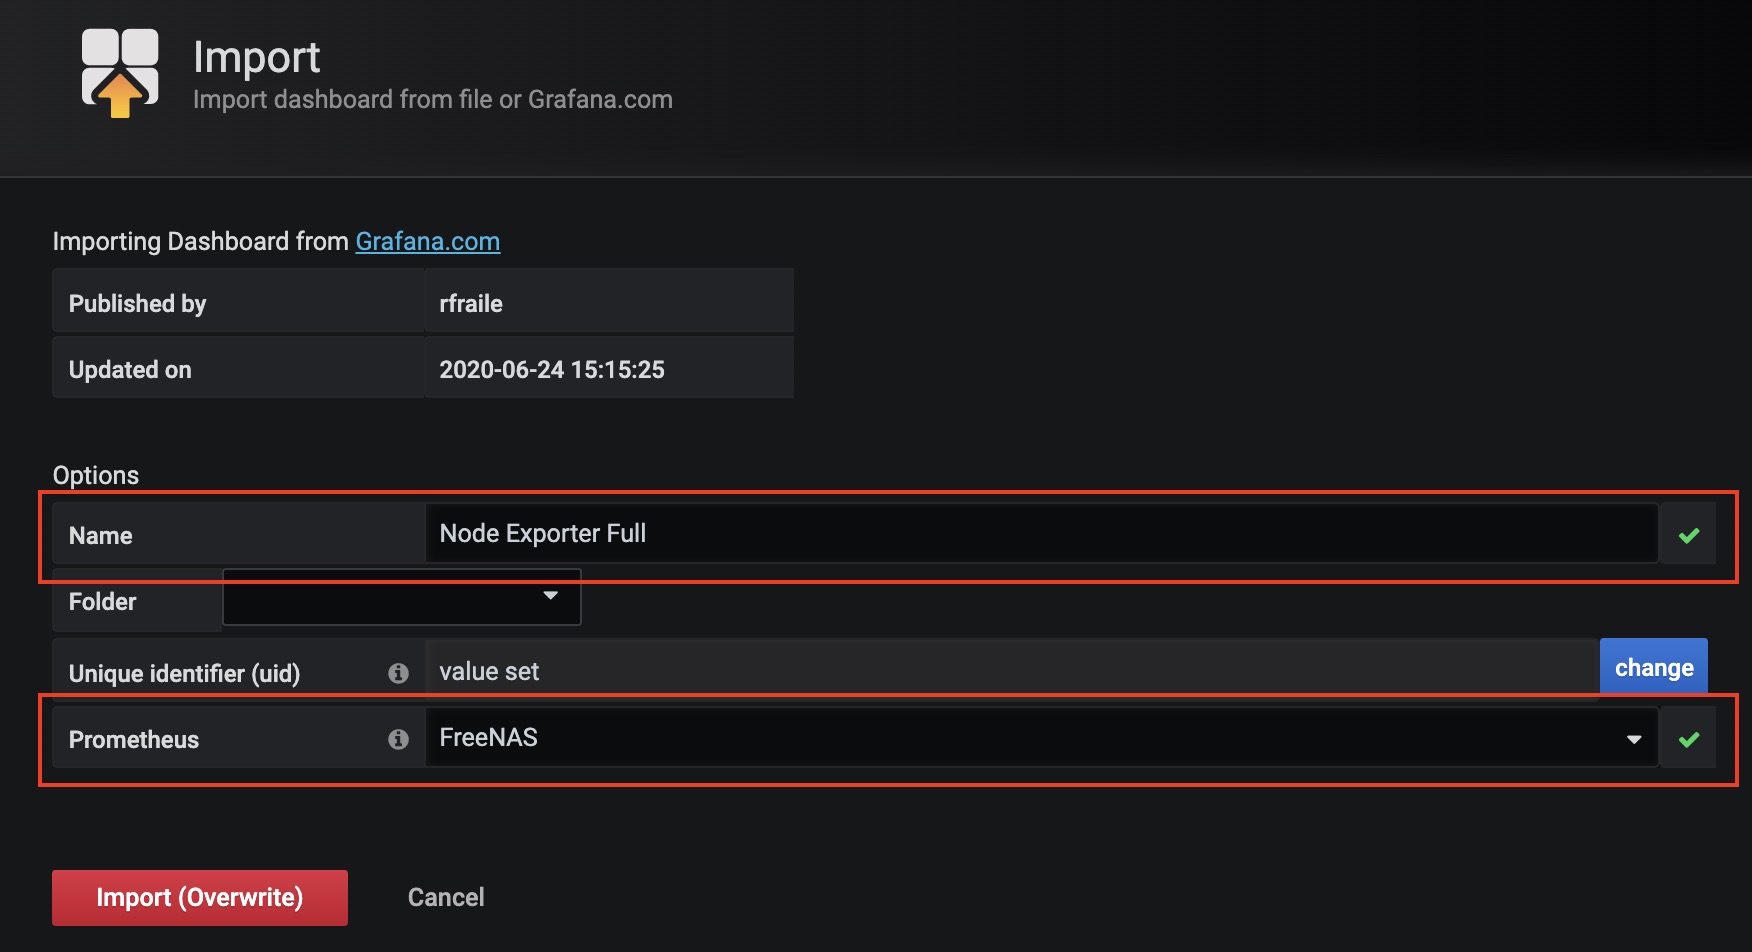
便能將數據透過此版面進行呈現
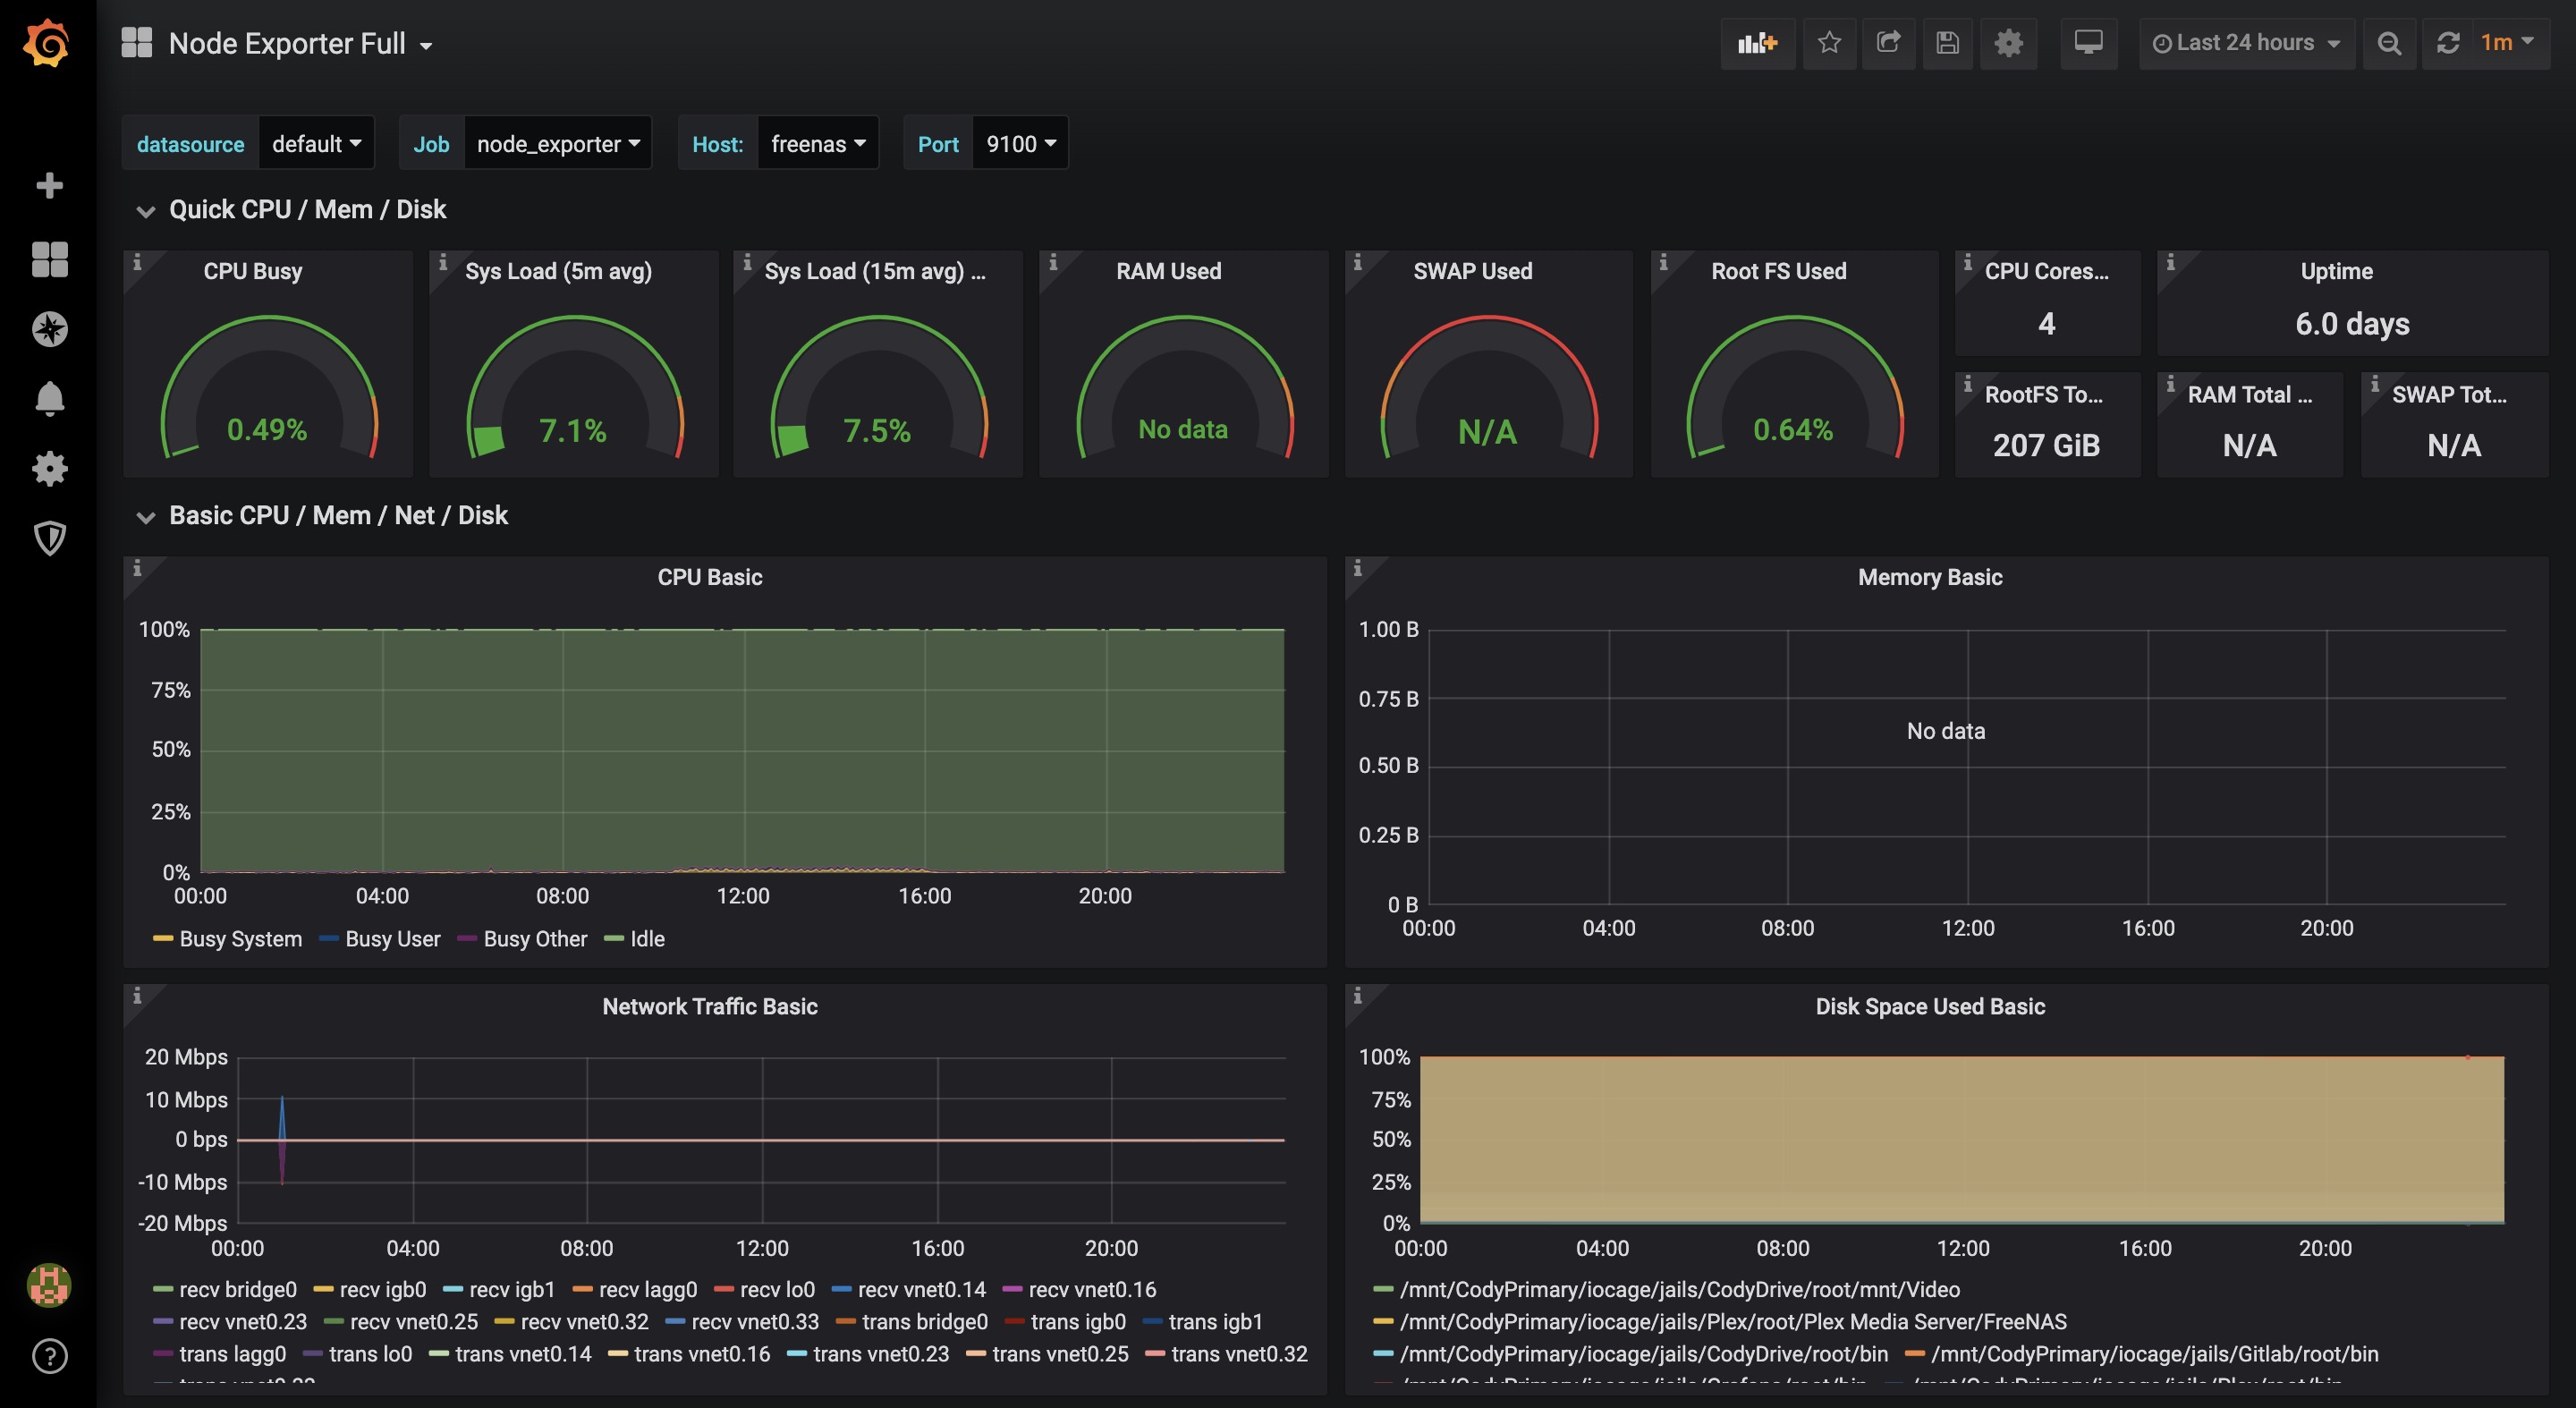
結論
可以看到數據視覺化的感覺是非常舒服的,之後還可以將各種主機加入進行監控
並且還有很多功能可以嘗試,特別需要研究告警的設定還有郵件寄送的功能