自己有架設 Proxmox 來當測試用的虛擬機伺服器,有想做的實驗或架設開源軟體的時候方便使用
因為沒有什麼重要的系統運行在上面,所以本來也沒有打算監控 Proxmox,但是 Grafana 實在太絢麗了
我很享受 Grafana 圖表的呈現方式,但是我的 Grafana 擺在那邊沒有資訊來呈現,感覺就挺怪的
所以就打算把 Proxmox 的系統資訊拿來呈現,也順便做一下(假)監控

Install Prometheus

我這邊直接將 prometheus 安裝在 proxmox 裡面,這邊只求方便,但是建議還是安裝在單獨的機器上

這邊基本上是照著 Monitoring proxmox with prometheus and grafana 這篇文章進行安裝

Create User

在 Proxmox 建立 prometheus 使用者

1
2
sudo groupadd --system prometheus
sudo useradd -s /sbin/nologin --system -g prometheus prometheus

Create Dir

建立 Prometheus 會使用到的目錄

1
2
sudo mkdir /var/lib/prometheus
for i in rules rules.d files_sd; do sudo mkdir -p /etc/prometheus/${i}; done

Download & Install

建立一個臨時目錄用來下載檔案,並進入目錄中

1
mkdir -p /tmp/prometheus && cd /tmp/prometheus

然後透過 github 下載當前最新的版本

1
2
3
4
5
curl -s https://api.github.com/repos/prometheus/prometheus/releases/latest \
  | grep browser_download_url \
  | grep linux-amd64 \
  | cut -d '"' -f 4 \
  | wget -qi -

下載完畢之後,進行解壓縮

並將執行檔、設置檔放置對應目錄中

1
2
3
4
5
tar xvf prometheus*.tar.gz
cd prometheus*/
mv prometheus promtool /usr/local/bin/
mv prometheus.yml  /etc/prometheus/prometheus.yml
mv consoles/ console_libraries/ /etc/prometheus/

然後就可以把剩下不需要的檔案清除掉

1
2
cd ~/
rm -rf /tmp/prometheus

Systemd Configuration

建立 systemd 的設定檔,方便操作該服務

 1
 2
 3
 4
 5
 6
 7
 8
 9
10
11
12
13
14
15
16
17
18
19
20
21
22
23
24
25
26
27
sudo tee /etc/systemd/system/prometheus.service<<EOF

[Unit]
Description=Prometheus
Documentation=https://prometheus.io/docs/introduction/overview/
Wants=network-online.target
After=network-online.target

[Service]
Type=simple
User=prometheus
Group=prometheus
ExecReload=/bin/kill -HUP $MAINPID
ExecStart=/usr/local/bin/prometheus \
  --config.file=/etc/prometheus/prometheus.yml \
  --storage.tsdb.path=/var/lib/prometheus \
  --web.console.templates=/etc/prometheus/consoles \
  --web.console.libraries=/etc/prometheus/console_libraries \
  --web.listen-address=0.0.0.0:9090 \
  --web.external-url=

SyslogIdentifier=prometheus
Restart=always

[Install]
WantedBy=multi-user.target
EOF

最後把目錄擁有者給 prometheus

for i in rules rules.d files_sd; do sudo chown -R prometheus:prometheus /etc/prometheus/${i}; done
for i in rules rules.d files_sd; do sudo chmod -R 775 /etc/prometheus/${i}; done
sudo chown -R prometheus:prometheus /var/lib/prometheus/

然後就可以載入 prometheus systemd 的設定檔

啟動 prometheus 服務,並啟用開機啟動

1
2
3
sudo systemctl daemon-reload
sudo systemctl start prometheus
sudo systemctl enable prometheus

可以確認是否可以瀏覽 http://<Prometheus IP>/targets 確認是否安裝成功

Install proxmox-pve-exporter

Install Python3

這邊我改以安裝 python3

sudo apt install python3 python3-pip

然後透過 pip3 安裝 prometheus-pve-exporter

1
sudo pip3 install prometheus-pve-exporter

Create an authentication file

創建一個認證檔,讓 prometheus-pve-exporter 可以登入 PVE

Username 及 Password 請更改成自己可登入的帳戶密碼

1
2
3
4
5
6
7
sudo tee /etc/prometheus/pve.yml<<EOF

default:
    user: <Username>@pve
    password: <Password>
    verify_ssl: false
EOF

Systemd

一樣建立 prometheus-pve-exporter 的 systemd 的設定檔,方便操作該服務

 1
 2
 3
 4
 5
 6
 7
 8
 9
10
11
12
13
sudo tee /etc/systemd/system/prometheus-pve-exporter.service<<EOF
[Unit]
Description=Prometheus exporter for Proxmox VE
Documentation=https://github.com/znerol/prometheus-pve-exporter

[Service]
Restart=always
User=prometheus
ExecStart=/usr/local/bin/pve_exporter /etc/prometheus/pve.yml

[Install]
WantedBy=multi-user.target
EOF

載入設定檔,並啟動 prometheus-pve-exporter

然後啟用開機啟動服務

1
2
3
systemctl daemon-reload
systemctl start prometheus-pve-exporter
systemctl enable prometheus-pve-exporter

如果成功安裝完畢,可以前往 http://<Service IP>:9221/pve 確認是否可以取得系統資訊

Configure Prometheus

在最後新增 prometheus-pve-exporter 設定至 Prometheus

vim /etc/prometheus/prometheus.yml
...

- job_name: 'proxmox'
  metrics_path: /pve
  static_configs:
  - targets: ['localhost:9221']

重啟 prometheus 讓設定載入

1
sudo systemctl restart prometheus

然後透過瀏覽 http://<Prometheus IP>/targets 確認 prometheus-pve-exporter 狀態是否啟用

Install Grafana

將 Grafana 的安裝來源加入至 source list 中

sudo tee /etc/apt/sources.list.d/grafana.list<<EOF
deb https://packages.grafana.com/oss/deb stable main
EOF

並載入 Grafana gpg key

1
curl https://packages.grafana.com/gpg.key | sudo apt-key add -

然後就能輕鬆安裝 Grafana

並啟用 Grafana 的服務

1
2
sudo apt update && sudo apt install -y apt-transport-https grafana
sudo systemctl enable --now grafana-server

然後透過瀏覽 http://<Grafana IP>:3000,預設帳號密碼 admin/admin

Dashboard

最一開始我是直接逛 Grafana 中,其他人提供的 Dashboard

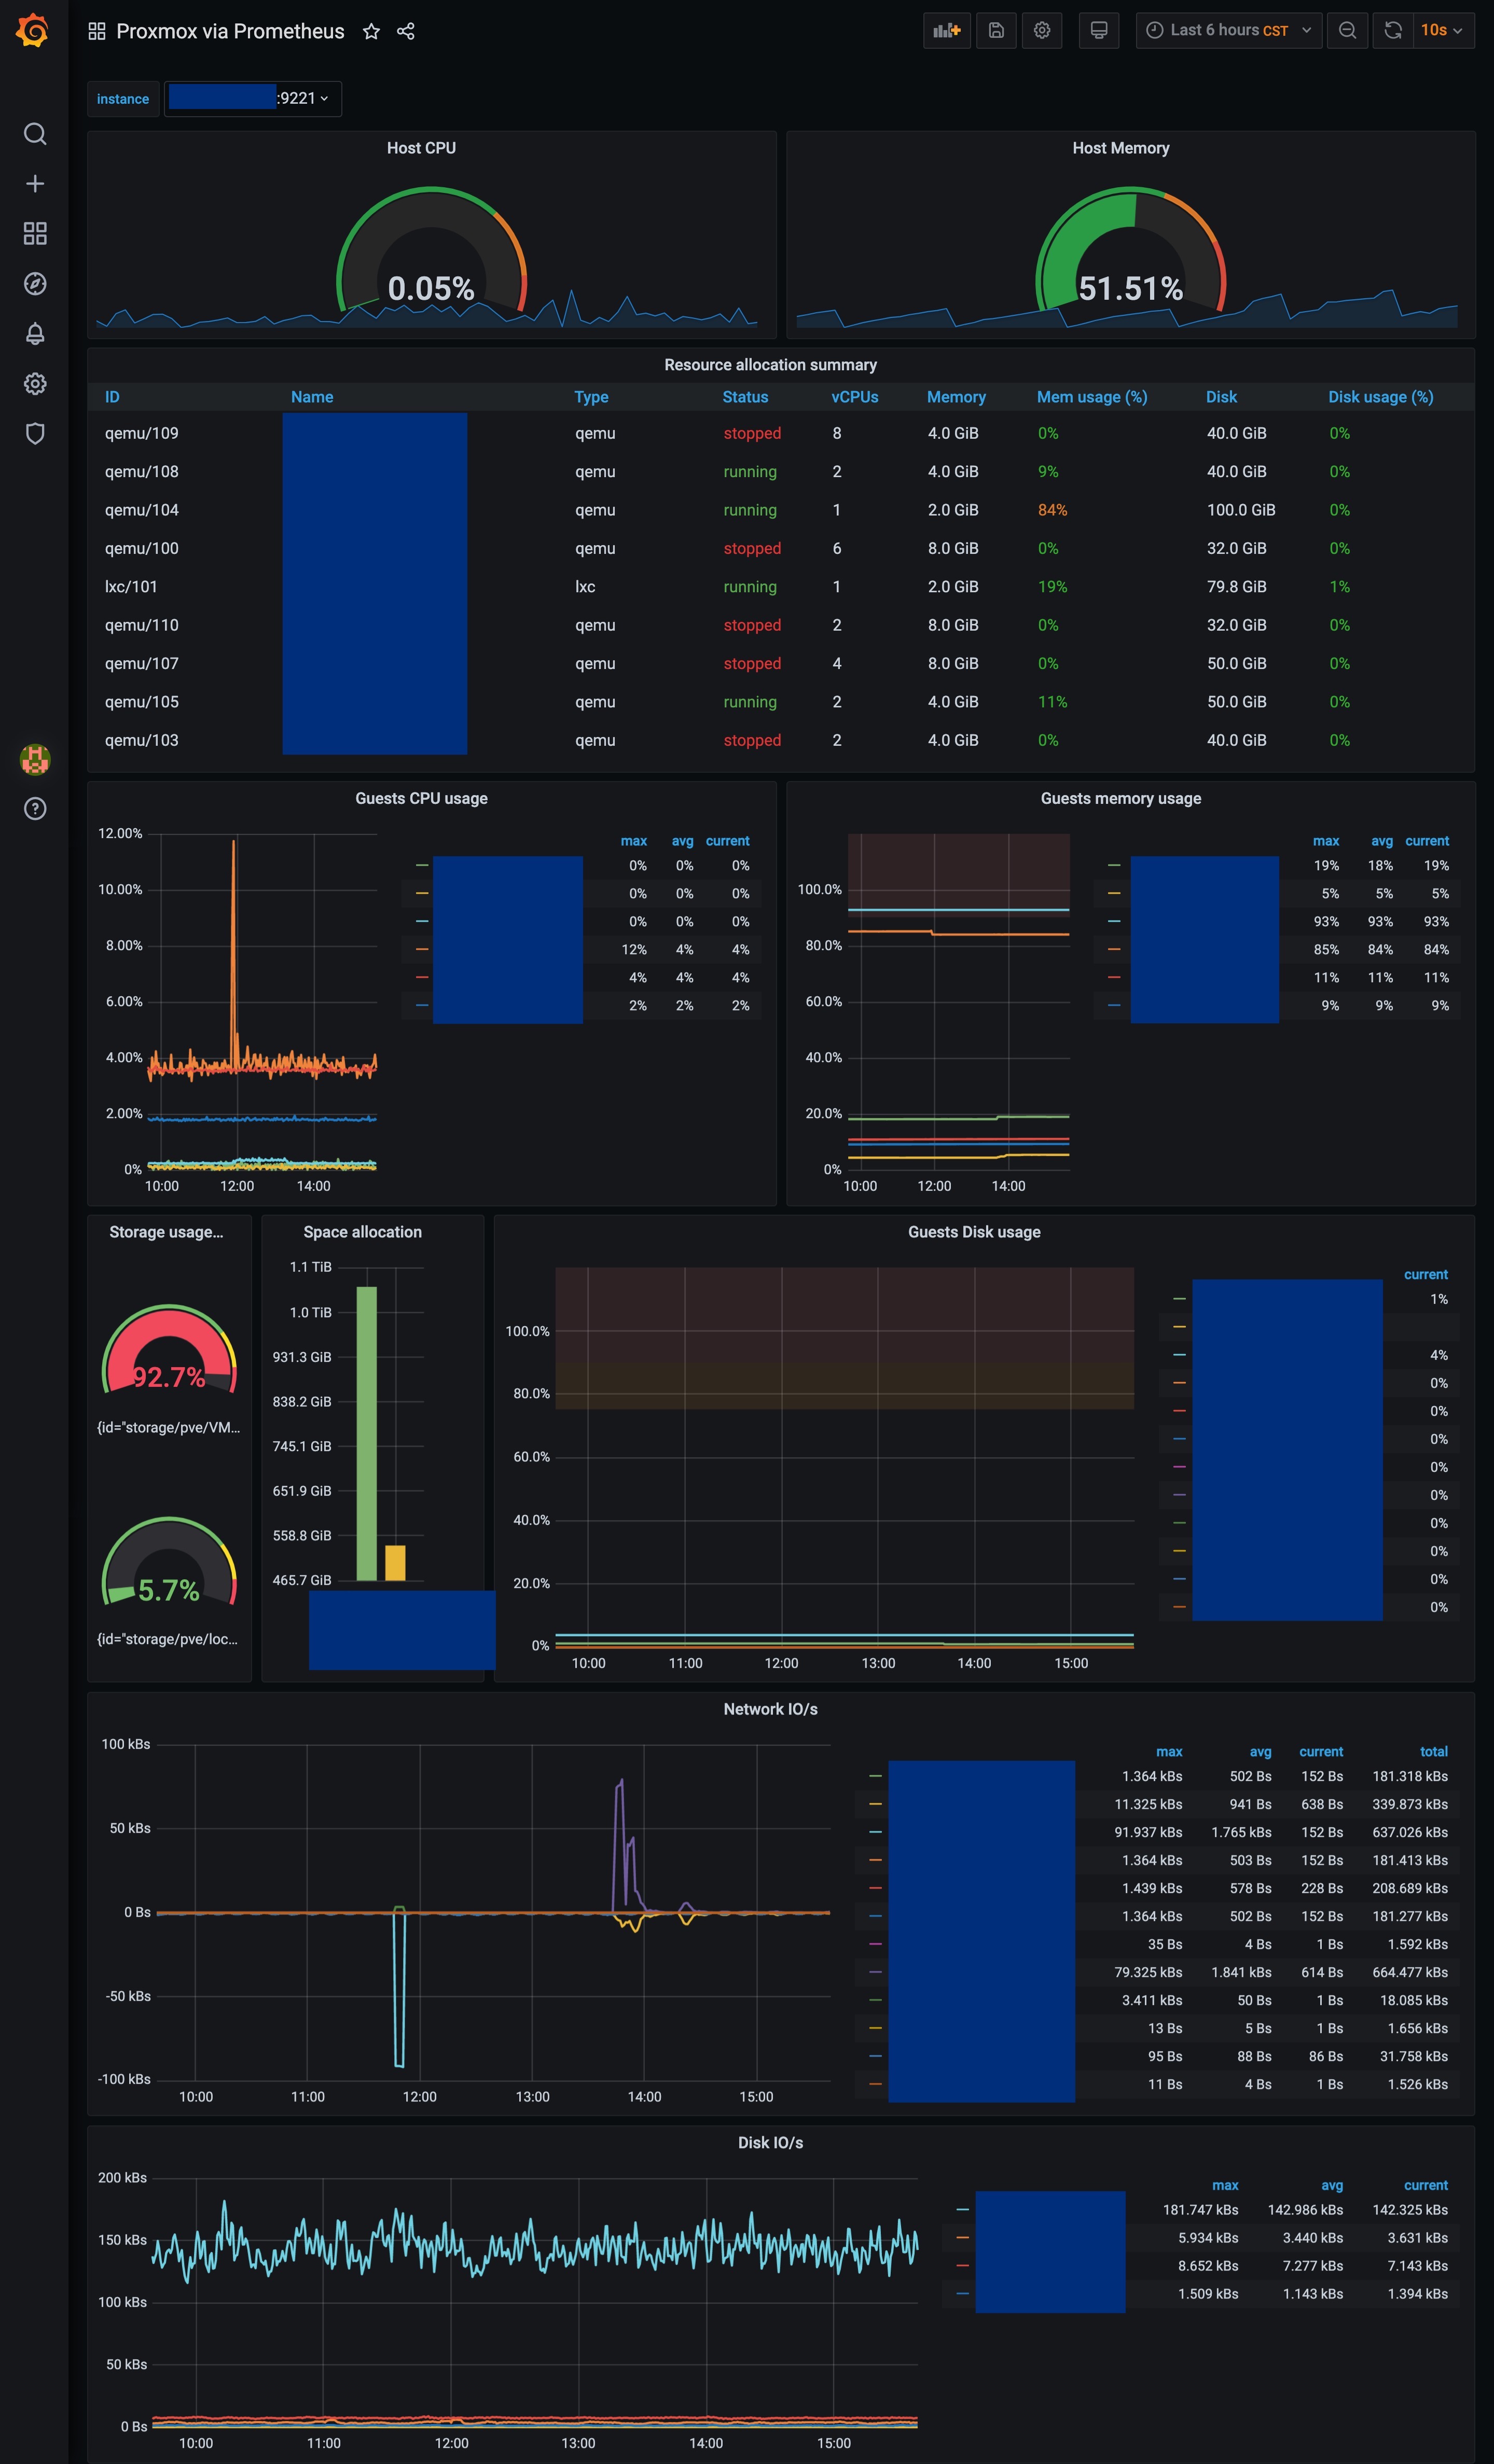
然後看到 Grafana: Proxmox via Prometheus 排版很舒服,而且資訊清晰
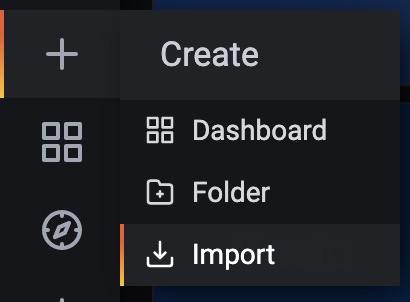
Import

透過側邊欄進入 Dashboard 的載入頁面

Import Page

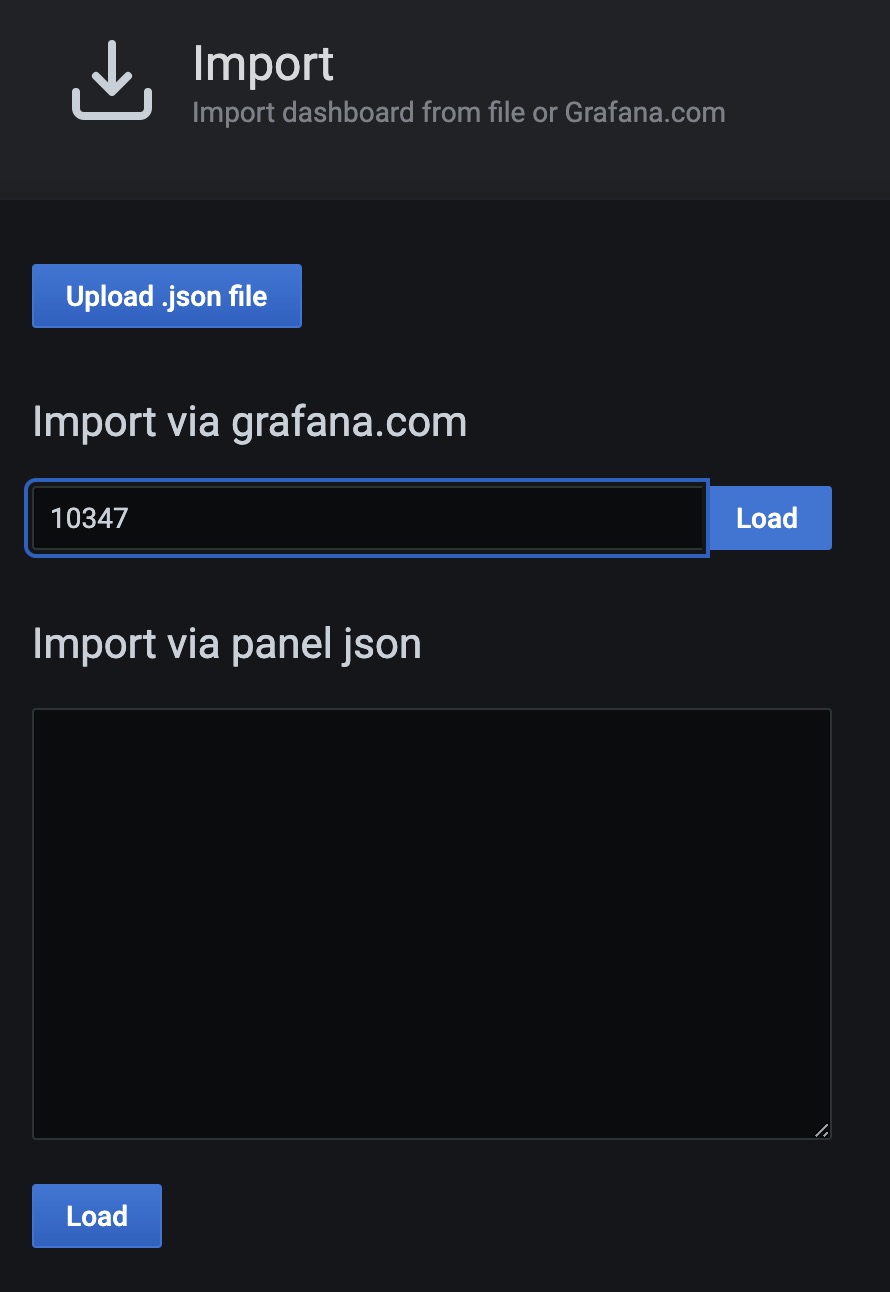
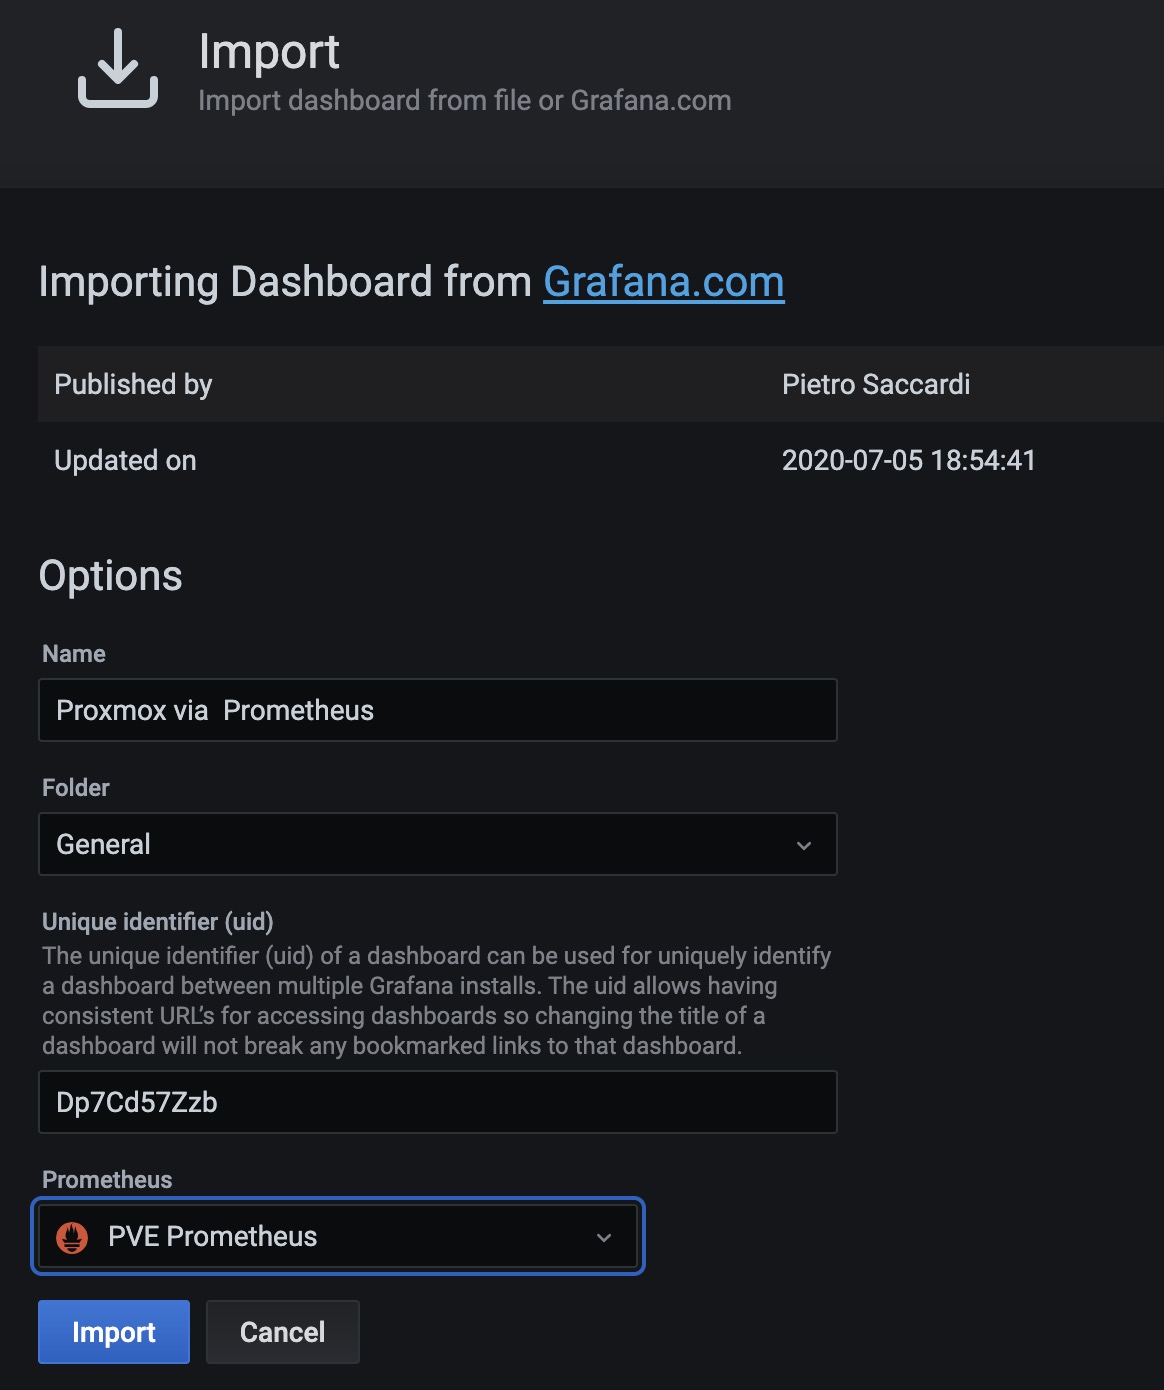
然後載入 Grafana: Proxmox via Prometheus 該 Dashboard 的 ID 10347 使用該作者的排版

Import Dashboard

然後設定好資訊來源為 PVE Prometheus

Configure Dashboard

就能看到 Grafana 的圖表,我自己是有把 CPU/Memory 改一下位置

Dashboard Screen

結論

Grafana 確實是一個非常好的資訊呈現系統,而且圖表呈現的風格我覺得非常科技風

並且提供的資訊圖表的呈現效果很不錯,加上該 Grafana: Proxmox via Prometheus 的作者提供的排版,十分的滿意

Ref

  1. Grafana: Proxmox via Prometheus

  2. Github: prometheus-pve-exporter

  3. Monitoring proxmox with prometheus and grafana